Theory and principles of cancer screening
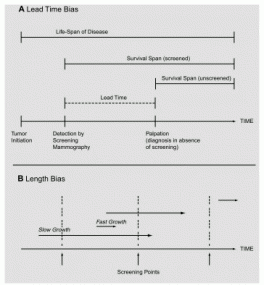
There are many difficulties in accurately determining the real benefit of any cancer screening technology or program. Two inherent biases must be taken in account: lead-time bias and length bias (Figure 1-3).
These biases can be minimized (but not completely eliminated) only by evaluating a screening modality through a randomized, controlled trial in which mortality is the end point. Lead-time bias is due to the assumption that the identification and treatment of tumors at an earlier point in the progression of the disease will necessarily alter the rate of progression.
Thus, a woman who survives 4 years after the diagnosis of a cancer identified during screening may be thought to have an increased survival time compared with that for an unscreened woman who finds a lump and dies 2 years after the diagnosis. However, once a cancer is identified by screening and is treated, it is impossible to know how long the woman would have survived if the cancer would have gone undetected until it became palpable. Likewise, it is impossible to know whether earlier detection and treatment of the woman with a 2-year postdiagnosis survival time would have resulted in a longer life for the woman if her cancer had been detected and treated sooner.

FIGURE 1-3 Lead-time (A) and length (B) biases. In panel B, the length of the arrows represents the time required for the tumor to reach a palpable size. For a more detailed description of lead-time and length biases, see the accompanying text in next section -.
Length bias reflects the fact that screening tests detect a disproportionate number of women with slowly progressing tumors. A cancer that takes several years to reach a palpable size will be detected as a smaller tumor by regular screening than one that grows to the same size in a much shorter time period. If an aggressive, fast-growing tumor is more likely to become life-threatening than a slow-growing tumor, then many women whose tumors were identified through a screening program will inherently have a more favorable outcome following treatment.
BOX 1.2
Cancer Risk
The term “risk” refers to the quantitative measure of the probability of developing or dying from a particular disease such as cancer. Several basic measures of risk may be used to make decisions for cancer screening, including estimates of absolute risk or relative risk, as defined below.
Absolute risk is a measure of risk over time in a group of individuals and may be used to measure lifetime risk or risk over a narrower time period. For example, the absolute risk of developing breast cancer during any given decade of life will be lower than the absolute risk of developing breast cancer over a lifetime, which is essentially a cumulative risk over successive decades of life. It is a function of two factors that vary at different ages: the incidence rate of disease and the rate of death from other causes, both of which increase with age but which have opposite effects on the absolute risk of developing breast cancer. Thus, the lifetime risk of developing breast cancer is 14.4 percent, whereas the absolute risk of developing breast cancer over the decade between the ages of 40 and 50 is 1.8 percent, that over the decade between the ages of 50 and 60 is 3.2 percent, and that over the decade between the ages of 60 and 70 is 4 percent (Wun et al., 1998).
Relative risk is a comparative measure and is based on a comparison of disease incidence in two populations. It compares the risk of developing cancer in people with a certain exposure or genetic trait (i.e., environmental or genetic risk factors) with that in people without this exposure or trait. A relative risk greater than 1 implies elevated risk for the disease, whereas a value less than 1 implies a protective effect for the given factor. For example, smokers are 10 times more likely to develop lung cancer than nonsmokers and are thus said to have a 10-fold relative risk of developing lung cancer compared to nonsmokers (American Cancer Society, 2000). However, most relative risks for cancer are not this large. In the case of breast cancer, the relative risk associated with most defined risk factors is 2 or less. For example, women with a first-degree (mother, sister, or daughter) family history of breast cancer have about a two-fold relative risk of developing breast cancer compared with that for women without such a family history.
Relative risks may seem large while the corresponding absolute risk may be relatively small. For example, the relative risk for thyroid cancer following therapeutic radiation therapy is increased 16-fold compared with the risk for the general population; however, this translates to an absolute risk of 1.7 percent over the 20-year period following radiation exposure (Hancock et al., 1991). Absolute risks may be directly compared with one another, whereas relative risks may vary depending on the reference (control) population being studied.